rp-excel
.... calculating success with AI
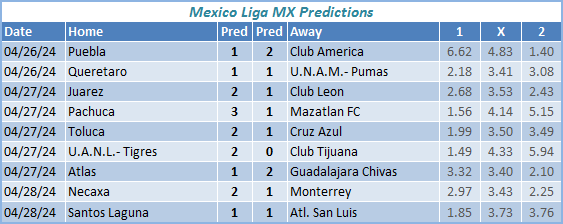
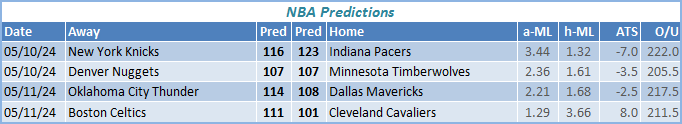
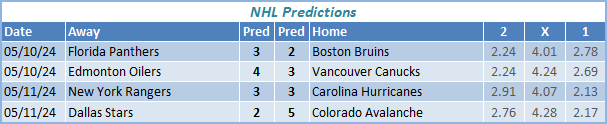
rpxl Predictions
Soccer, NBA, and NHL predictions are based on historical results, using genetic algorithms and monte carlo simulations, for forecasting... Player injuries and other factors are not taken into consideration.
All lines are from OddsPortal and/or FanDuel Sportsbook
Horse Racing
Free Membership
Only members are able to view the trends and suggested plays for NBA, NHL, and Soccer.
Membership is FREE - Sign Up
If you have any issues please Contact Me