NFL Home Team Favorites Win Percentages
How important are the actual points scored in predicting future outcomes?
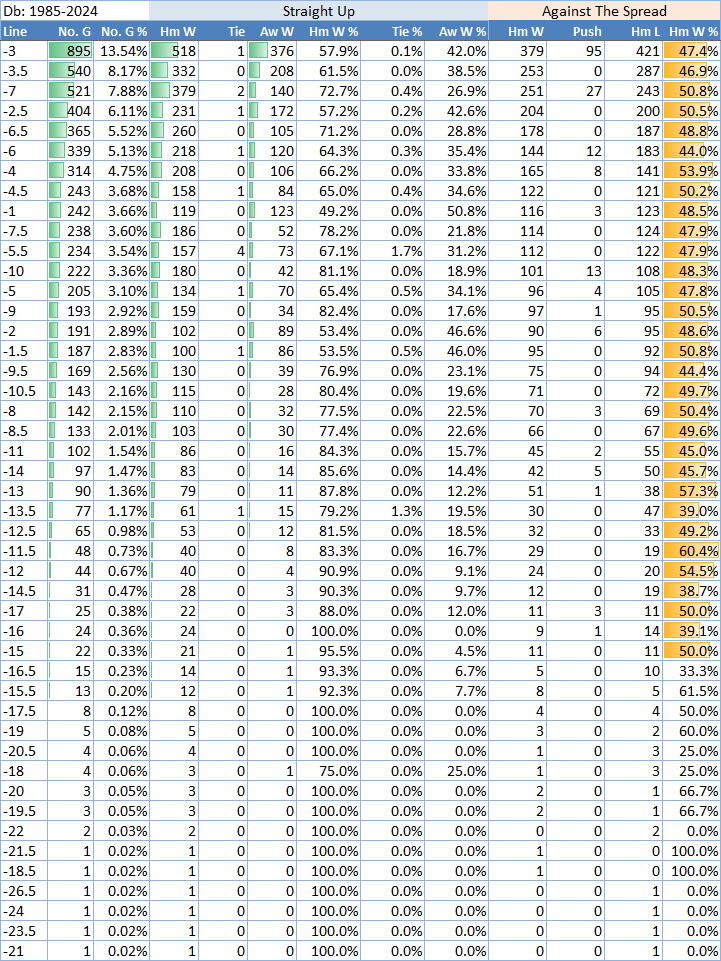
All NFL seasons from 09-08-1985 through 02-11-2024 — a total of 10,036 games.
Here is the complete breakdown...
How The Data Is Organized
Each row represents a unique closing line at which a team has been a home favorite. No. G is the count of games at that line, Hm W and Aw W are straight-up wins by the home and away teams, and the right-hand columns show the same matchups graded against the spread (Hm W ATS / Aw W ATS, with pushes excluded).
The Headline Numbers
Across nearly four decades of data, home favorites win straight up roughly 65–70% of the time at common line sizes (-3 to -7), which is exactly what the public expects. The interesting story is in the ATS column: home favorites cover the spread very close to 50% — usually 47–51%. The market is highly efficient on these games.
Pairing With Points Per Game
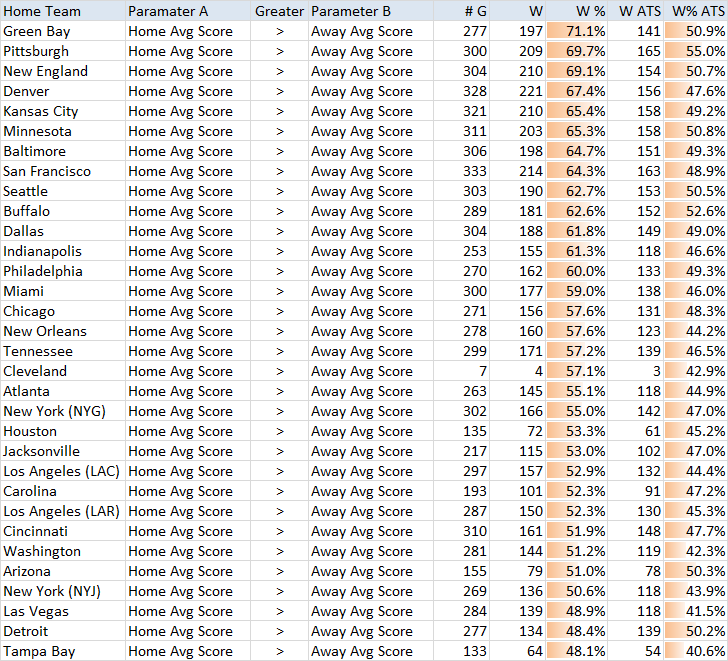
When you overlay home-favorite data with each team's average points scored at home, the picture sharpens. High-scoring home teams (Green Bay, Pittsburgh, New England, Denver, Kansas City) are the most reliable straight-up winners as favorites, and they also produce the cleanest ATS records.
Practical Use
- Avoid heavy home favorites (lines greater than -10) — covers drop sharply as line size grows.
- Look for mid-range home favorites (-2.5 to -5) where ATS rates are most stable.
- Combine the line-based table with a team's home PPG to filter out artificially-inflated favorites.