NFL Betting Lines
Where the oddsmakers — historically — have left edges on the board
How A Line Is Set
Every sportsbook attempts to set a line where 50% bet one way and the other 50% bet the opposite way. With this in place, the books are always profitable. Once the line is set and the public heavily bets one way, the book moves the line to equalize action. This analysis assesses whether there are any persistent edges when it comes to NFL betting lines against the spread.
The last 10 NFL seasons (2012–2021) — 2,690 games. Only closing lines that appeared more than 50 times are included.
The Premise
We're all aware of how accurate the oddsmakers are. The market is brutally efficient. That said — there are a few specific closing lines where the oddsmakers have shown statistically meaningful inconsistency over the last decade. Those are the spots worth highlighting.
The Edges
Although oddsmakers are incredibly adroit at setting lines, the following four spots have historically offered an advantage to the bettor:
Takeaway
- The away side is where the persistent inefficiency has lived — three of the four edges are away dogs.
- +5 to +5.5 road dogs and +10 road dogs have outperformed the market by a wide margin.
- −7 road favorites also stand out — a spot where the public typically lays the points and loses.
- All figures are historical. Always shop for the best number and re-validate with current data.
Why These Spots Exist
Lines like +5, +5.5, +7 and +10 are key numbers in NFL betting because of how often games land on or near a field goal or touchdown margin. When public money piles onto the home favorite at these prices, the oddsmakers respond by stretching the number — and that's where road sides have historically found their long-term edge.
The Full Breakdown
Each of the tables below contains the same 18 closing lines that appeared at least 50 times over the past 10 NFL seasons — sorted by a different dimension to surface different angles.
Sorted by Line Frequency (% Line)
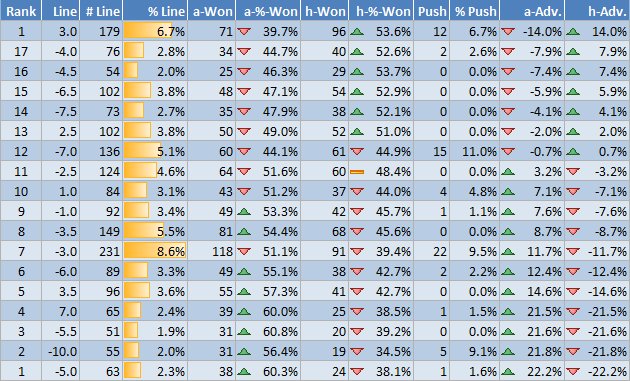
The two most commonly used lines were −3 (Home Favorite) and +3 (Away Favorite), followed by −3.5, −7.0, −2.5, −6.5, and 2.5.
Sorted by Away Win %
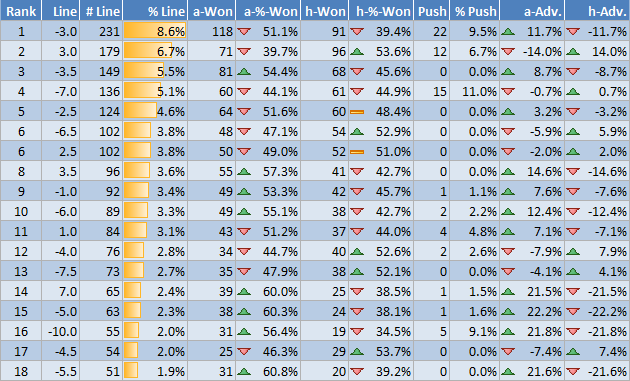
The area of opportunity seems to be with the away teams. Six lines — −5.5, −5.0, 7.0, 3.5, −10.0 and −6.0 — all produced an away win rate greater than 55%.
Sorted by Home Win %
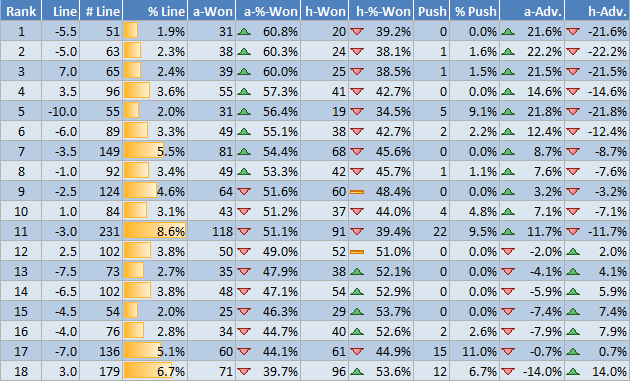
There is less opportunity on the home side — none of the qualifying lines produced a home win rate greater than 55%.
Sorted by Away Win Advantage %
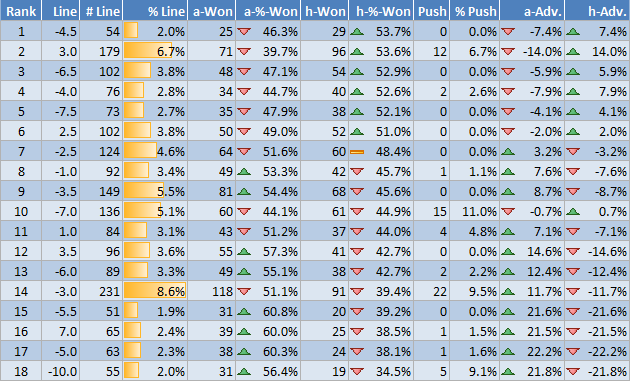
Four lines show a greater than 20% difference between winning and losing. Betting on the away team when favored by 7.0 points, or as an underdog at +5.0, +10.0 and +5.5, has historically offered a significant advantage.
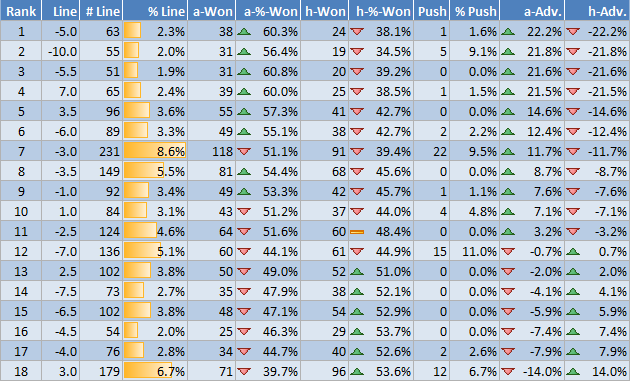
Sorted by Home Win Advantage %
Only one line — +3.0 — shows a greater than 10% difference between winning and losing on the home side. Betting on the home team as a 3.0-point underdog has offered a roughly 14% advantage.