Back to home
NFL Analytics

NFL Field Goal Attempts Per Game

How important are Field Goal Attempts in predicting future outcomes?

Dataset

All NFL seasons from 09-07-1986 through 02-11-2024 — a total of 9,803 games.

9,803
Games analyzed
1986 – 2024
38
NFL seasons
cumulative dataset
H / A
Split averages
home & away tracked separately

Methodology

All averages are cumulative — every game played prior to the matchup date is averaged together. That means a game played in 2023 includes the running average of every NFL game played since 1986.

The average Field Goal Attempts for Away Teams includes only games played away, and the average Field Goal Attempts for Home Teams includes only games played at home.

The Results

Home Teams With More Field Goal Attempts

When the home team enters the game averaging more field goal attempts than the visitor, the home team has historically won straight up at well above a coin-flip rate. The leaderboard is dominated by franchises with long histories of disciplined offenses that consistently move the chains: Cleveland, Green Bay, New England, Pittsburgh and Denver all sit at the top of the table. The ATS results, as expected, regress toward 50% — but the top teams still cover at a profitable clip.
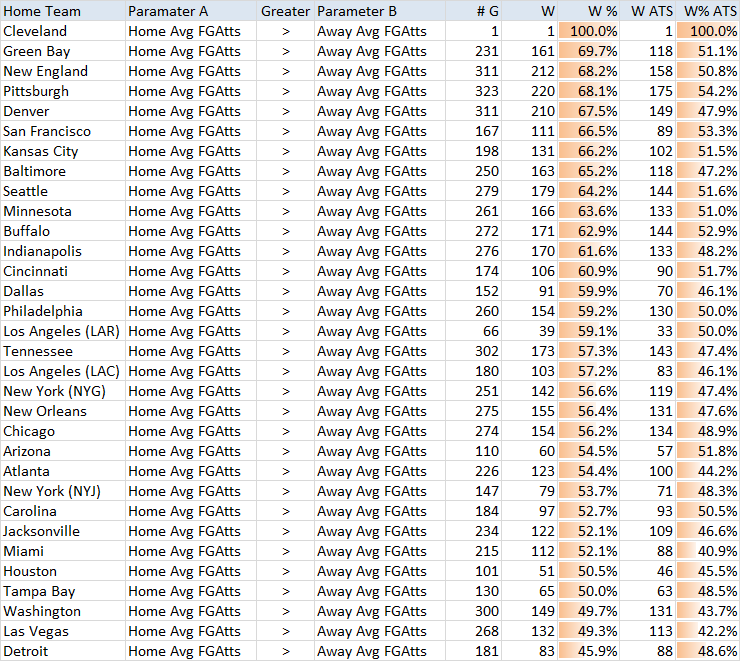
Home team field goal attempts data
Home team SU and ATS performance when averaging more FG attempts than the opponent

Away Teams With More Field Goal Attempts

On the road the signal is noisier but still useful. Visiting teams that attempt more field goals than the home team tend to win at a lower clip than the home-side scenario, which is expected given the inherent home-field advantage in the league. However, several franchises — Baltimore, San Francisco and Pittsburgh among them — post excellent ATS numbers when traveling as the higher-FG-attempt team.
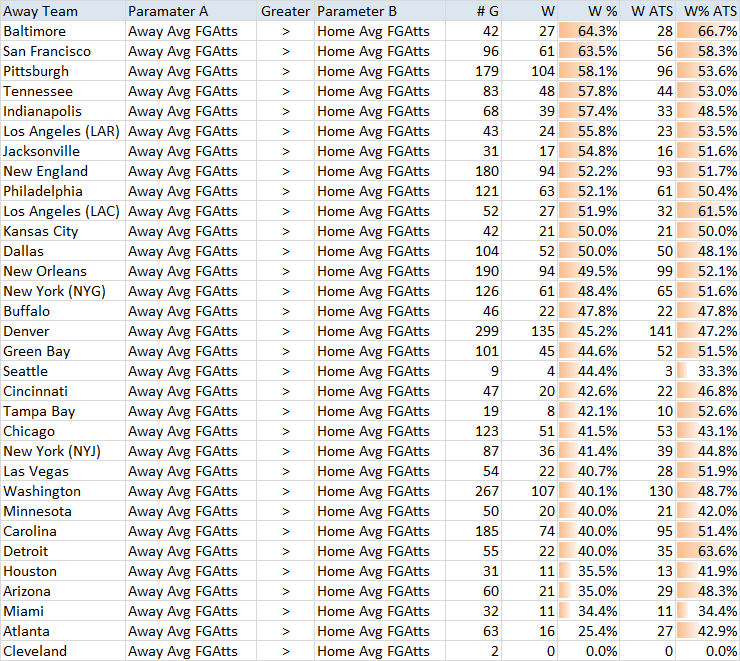
Away team field goal attempts data
Away team SU and ATS performance when averaging more FG attempts than the opponent

Key Takeaways

  • FG attempts is a stable, slow-moving stat — perfect for season-long modeling.
  • Home teams with the FG-attempt edge convert that edge into wins more reliably than visitors do.
  • The ATS edge is smaller but still positive for the top tier of teams, suggesting the betting market under-prices this metric.
rp-excel

AI-powered sports predictions using genetic algorithms and Monte Carlo simulations.

Disclaimer

This site is for informational and entertainment purposes only. The sports predictions, analysis, and information provided on rp-excel.com are opinions only and do not constitute professional, financial, or betting advice. There are no guarantees of accuracy, profitability, or success. Past performance is not indicative of future results.

Individual users are solely responsible for complying with all applicable laws regarding gambling and accessing betting-related information in their jurisdiction. Many countries and regions prohibit or restrict gambling—please verify and follow the laws in your location. Any use of this information that may violate any federal, state, local, or international law is strictly prohibited.

RP Excel is not affiliated with, endorsed by, or sponsored by any professional or amateur sports organizations, online gambling websites, casinos, or sportsbooks.

Gambling involves risk. Only bet with money you can afford to lose. Gamble responsibly.

RP Excel and rp-excel.com will not be liable for any losses, injuries, or damages (direct, indirect, special, consequential, or otherwise) arising from the use or reliance on any information displayed on this website.

Under no circumstances shall rp-excel.com or its owners, operators, or members be liable to any party for any damages related to the use of this website.

© 2007–2026 rp-excel.com